Maintenance Mode Predictor





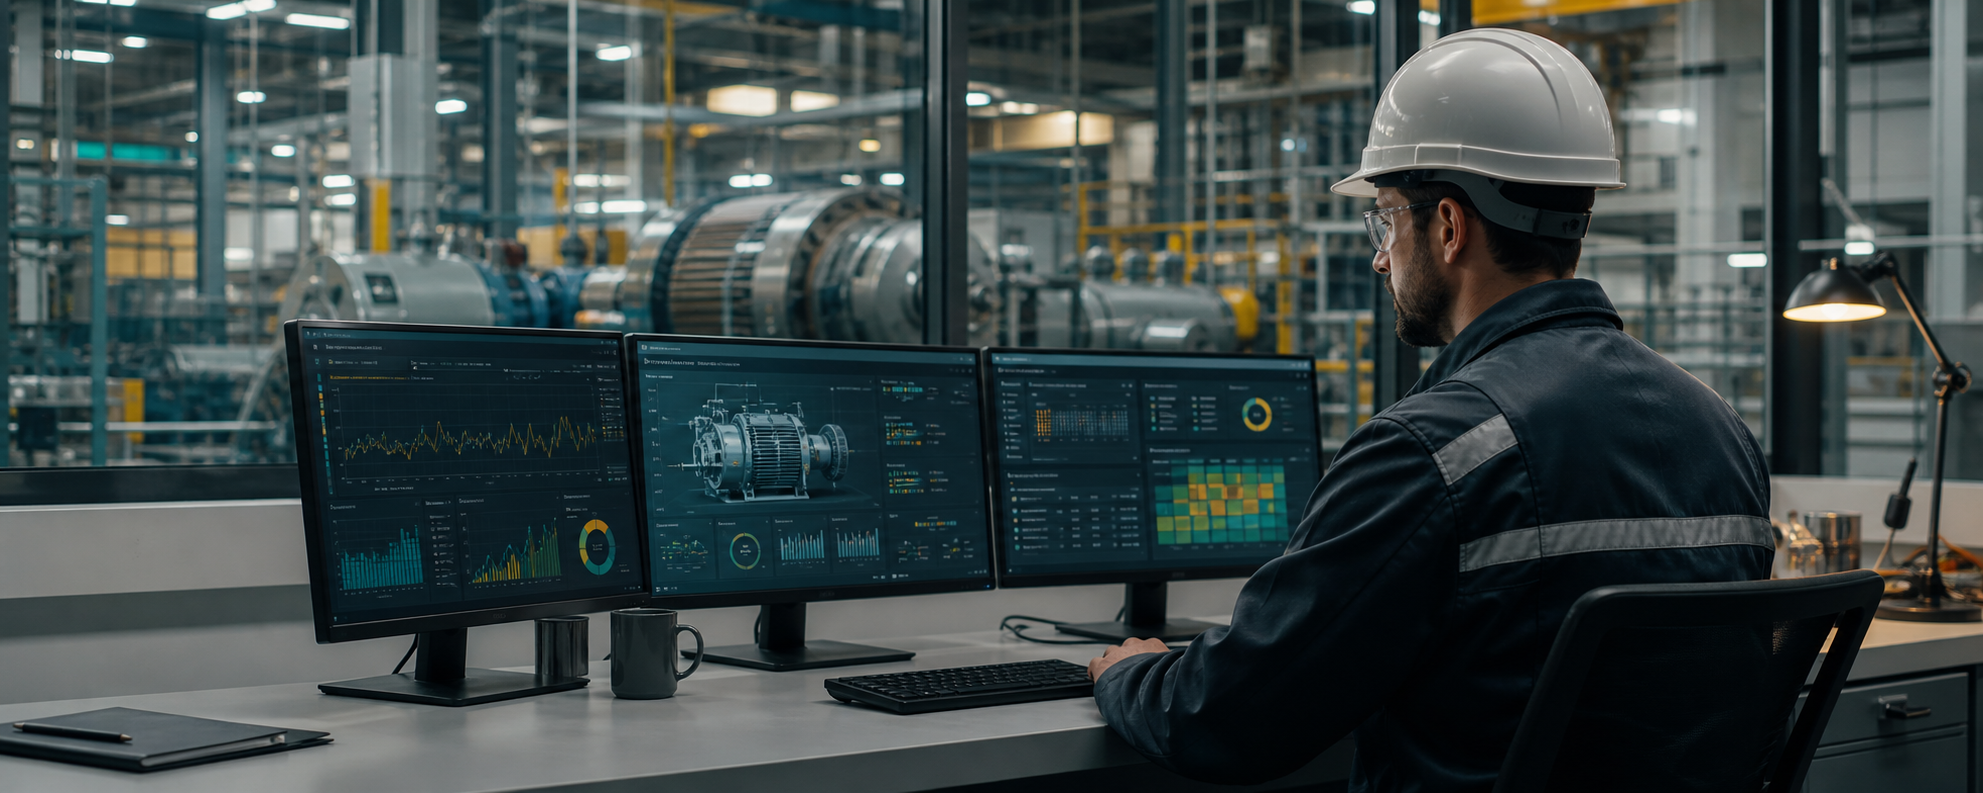
This project began as a statistics class decision-tree notebook: classify whether a machine record looked like Failure or Production using maintenance and sensor data.
That was the classroom version.
The industrial-engineering version asks harder questions:
- Is the label actually defined correctly?
- Is the strongest signal a real pre-decision sensor, or leakage?
- Would this help maintenance planning, or only produce a good accuracy number?
- What data would be needed to move from current-state classification to true future-failure prediction?
The result is a compact predictive-maintenance workflow with audit reports, model comparison, decision-cost thinking, quality gates, and a synthetic temporal demo for the future-state architecture.
The Short Version
| Area | Current State |
|---|---|
| Original data | Static Excel workbook, 353 rows |
| Current model boundary | Current-state classification, not real future-failure prediction |
| Baseline model | Interpretable decision tree |
| Main finding | Sensor5 dominates the model and must be engineering-validated |
| Best static result | Decision tree / random forest around 0.9772 macro F1 in cross-validation |
| Biggest blocker | No timestamp, asset ID, or future failure horizon in the original workbook |
| Industrial upgrade | Future-data contract, temporal labeling, time-based split demo, quality gates |
Why This Matters
In maintenance engineering, accuracy is not enough. A missed failure can mean unplanned downtime, safety exposure, damaged equipment, and production loss. A false alarm can mean unnecessary inspections, spare-part waste, and avoidable planned downtime.
So the project is intentionally framed around reliability questions:
What does the model know?
When would it know it?
What action would a planner take?
What would a wrong prediction cost?
The original workbook can support a useful classification baseline. It cannot, by itself, prove predictive maintenance. That distinction is the backbone of the project.
Evidence Snapshot
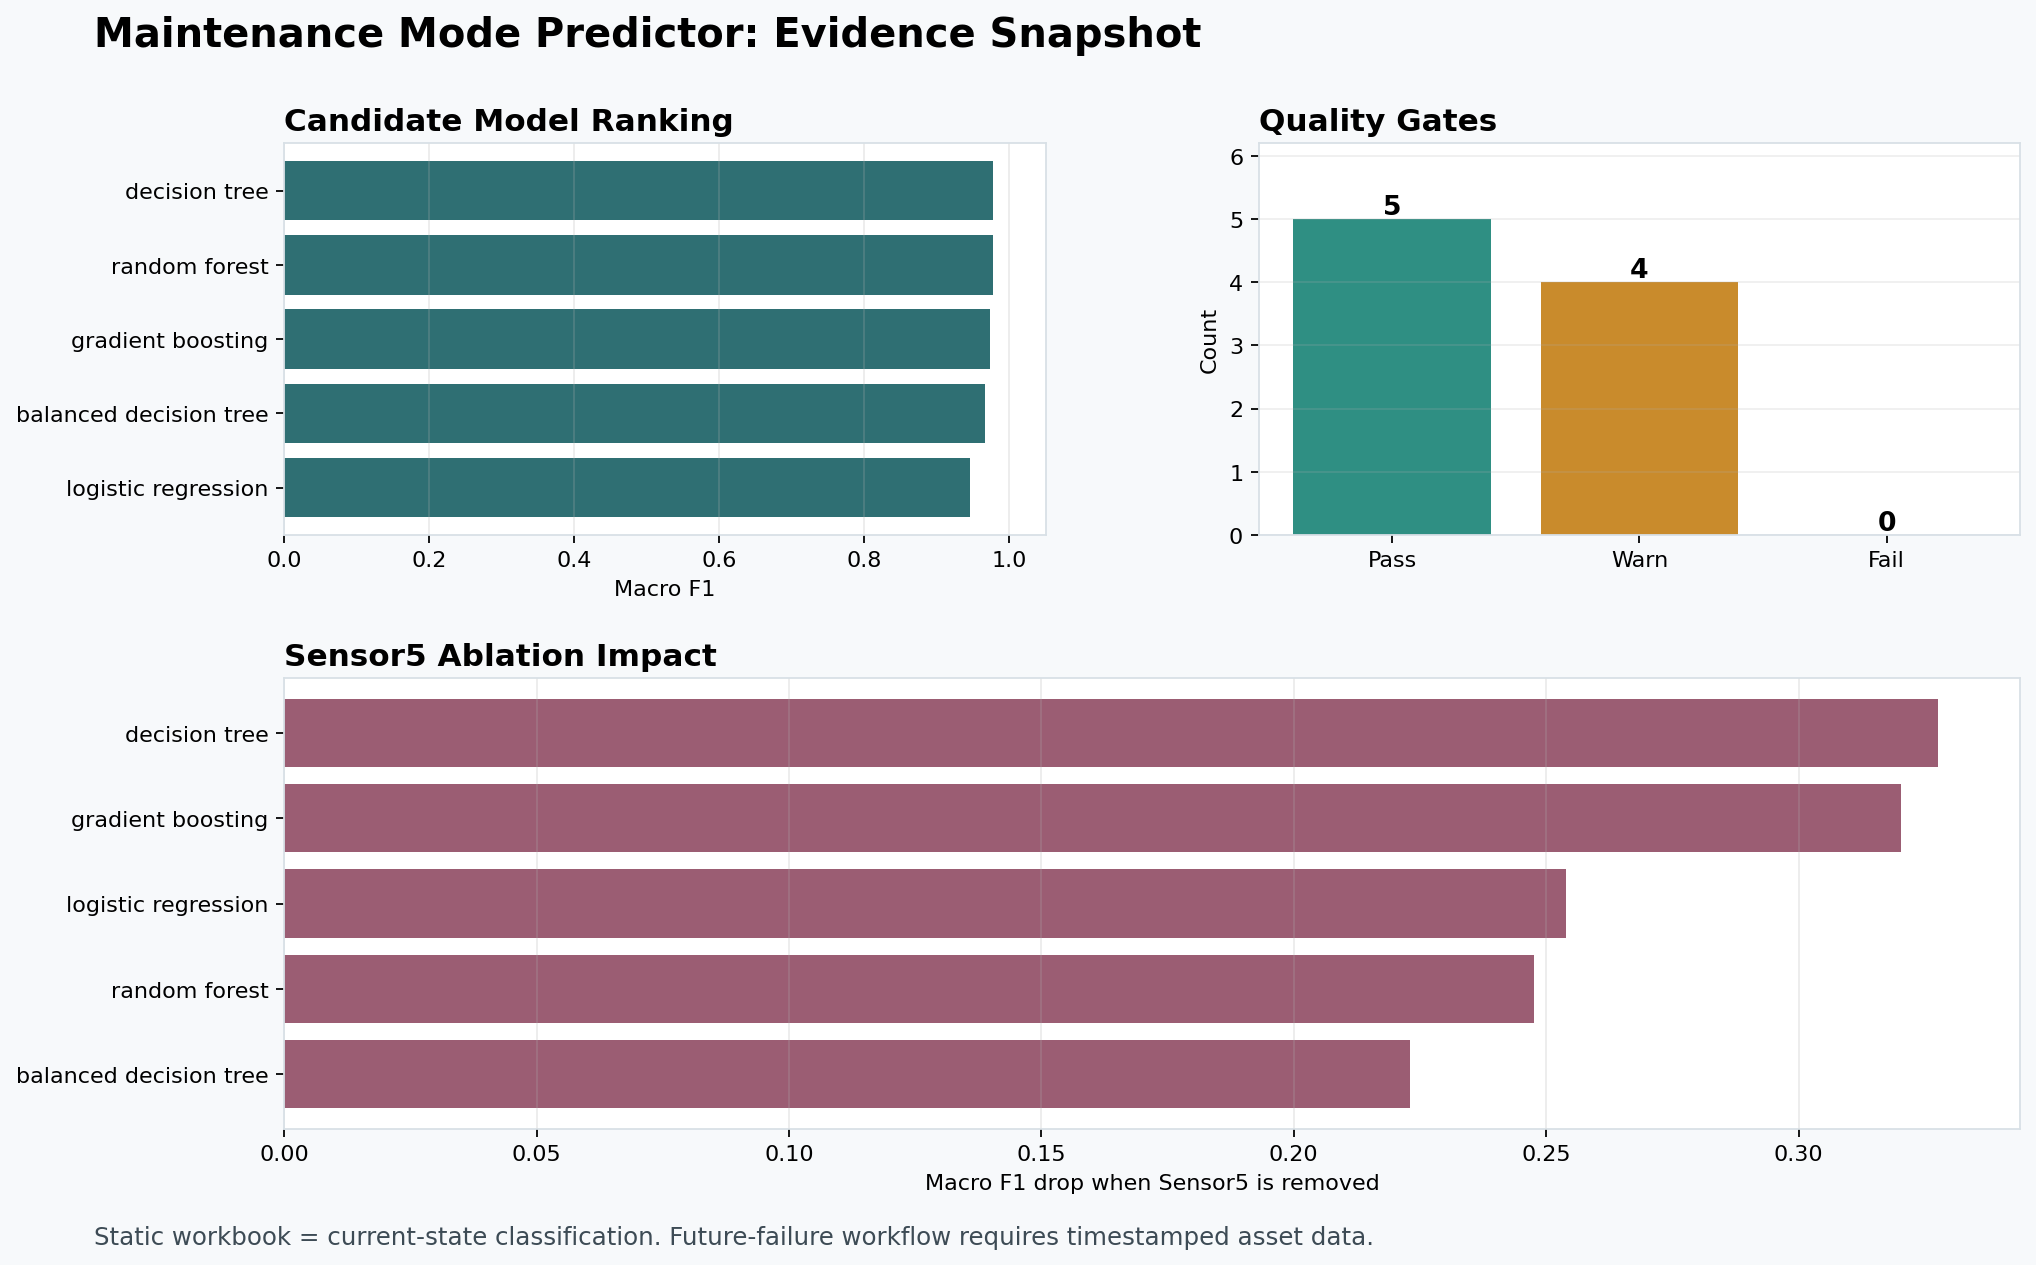
Key generated reports:
- Data audit
- Model report
- Model comparison
- Decision-cost report
- Quality gates
- Synthetic temporal model report
What The Project Found
Under the current label assumption, Operation_modes means:
| Label | Meaning | Complete-case rows |
|---|---|---|
0 |
Failure | 253 |
1 |
Production | 93 |
That distribution matters because the original project text described production as the majority class. The repo now treats that as a governance issue, not a footnote.
Static model comparison:
| Model | Uses Sensor5 |
Accuracy | Macro Recall | Macro F1 |
|---|---|---|---|---|
| Decision tree | Yes | 0.9826 | 0.9711 | 0.9772 |
| Random forest | Yes | 0.9826 | 0.9711 | 0.9772 |
| Gradient boosting | Yes | 0.9797 | 0.9656 | 0.9732 |
Balanced decision tree without Sensor5 |
No | 0.7860 | 0.7613 | 0.7442 |
Decision tree without Sensor5 |
No | 0.7369 | 0.6483 | 0.6496 |
The baseline decision tree is deliberately kept because it is simple, inspectable, and easy to explain. But the result is only respectable if the strongest feature is valid.
The Sensor5 Question
Sensor5 has about 0.9856 feature importance in the baseline tree. Removing it drops macro F1 by up to 0.3275 across model families.
That can mean one of two very different things:
Sensor5is a physically meaningful condition signal.Sensor5is an alarm/status/diagnostic field that leaks the answer.
An industrial engineer should not deploy the model until this is resolved. The quality-gates report keeps this warning visible on every full run.
What Is Credible Today
This project is credible as:
- a statistics-class model matured into an industrial analytics workflow,
- a reproducible current-state classification baseline,
- a model-risk and data-governance case study,
- a predictive-maintenance scaffold for when timestamped asset data exists.
It is not yet credible as:
- an operational predictive-maintenance system,
- an automatic work-order trigger,
- a safety-critical decision tool,
- proof of future-failure prediction from the original workbook.
Industrial Architecture
flowchart LR
    A[Static workbook] --> B[Data audit]
    B --> C[Baseline classifier]
    C --> D[Model comparison]
    D --> E[Sensor5 ablation]
    E --> F[Quality gates]
    F --> G[Decision-cost review]

    H[Future asset log] --> I[Forward-looking labels]
    I --> J[Time-based split]
    J --> K[Future-failure model demo]
    K --> F
Run It
Install:
python3 -m pip install -r requirements.txt
If you are using the local myenv virtual environment:
source myenv/bin/activate
Run the full reproducible workflow:
python3 scripts/run_all.py
or:
make run-all
The full workflow regenerates reports, model artifacts, static scoring outputs, temporal-demo outputs, quality gates, and tests.
Expected ending:
Ran 20 tests
OK
All workflow steps completed.
Useful individual commands:
make audit          # data quality and label audit
make train          # baseline decision-tree report
make compare        # candidate model comparison
make decision       # assumed maintenance cost thresholds
make quality        # reproducibility and industrial-risk gates
make test           # unit tests
Notebook
The notebook is here: Open the notebook on GitHub
It is intentionally output-light and narrative-driven. It is the lab bench for EDA, plots, leakage intuition, and industrial interpretation. The scripts are the repeatable production-style workflow.
Future Predictive Maintenance Path
The original workbook has no asset timeline, so the repo includes a future-data contract and a synthetic temporal demo.
A real future-failure dataset should contain:
asset_idprediction_timestamp- raw sensor values known at prediction time
- maintenance action history
failure_timestamp- failure mode
- downtime and repair cost
Then labels can be built honestly:
failure_within_7_days = 1
if a failure occurs after prediction_timestamp
and within the next 7 days
Demo commands:
python3 scripts/generate_synthetic_future_log.py \
  --output reports/synthetic_future_log.csv \
  --assets 12 \
  --days 90 \
  --seed 42

python3 scripts/train_future_model.py \
  --input reports/synthetic_future_log.csv \
  --horizon-days 7 \
  --test-start 2026-03-01T00:00:00Z
The synthetic demo proves the workflow mechanics only. It is not real maintenance evidence.
Repository Map
| Path | Purpose |
|---|---|
maintenance_analysis.ipynb |
Exploratory notebook and story-building workspace |
src/maintenance_predictor/ |
Reusable data, modeling, temporal labeling, decision, and quality-gate logic |
scripts/ |
Command-line workflows |
reports/ |
Generated evidence and review artifacts |
docs/data_dictionary.md |
Feature and label-governance notes |
docs/future_data_contract.md |
Required schema for real predictive-maintenance data |
docs/implementation_plan.md |
Phased engineering roadmap |
templates/ |
Starter future-maintenance CSV template |
assets/ |
README visuals |
Model Card In Brief
| Item | Value |
|---|---|
| Model type | DecisionTreeClassifier baseline |
| Current use | Portfolio, analysis, and current-state classification |
| Not for | automated shutdowns, safety-critical actions, automatic work orders |
| Main risk | label ambiguity and possible Sensor5 leakage |
| Required before pilot | validate labels, sensors, timing, costs, asset/time split |
Quality Gates
The latest quality-gates run has:
| Status | Count |
|---|---|
| Pass | 5 |
| Warning | 4 |
| Failure | 0 |
The warnings are intentional and important:
- label distribution must be confirmed,
Sensor5dominance must be explained,Sensor5ablation impact blocks model selection,- synthetic future workflow is not real operational evidence.
License
MIT License. See LICENSE.